Part 4 of 4: Other Popular Technical Analysis Tools & Indicators
Here are nine additional commonly used options you can choose from when searching for crypto trading indicators.
Relative Strength Index (RSI)
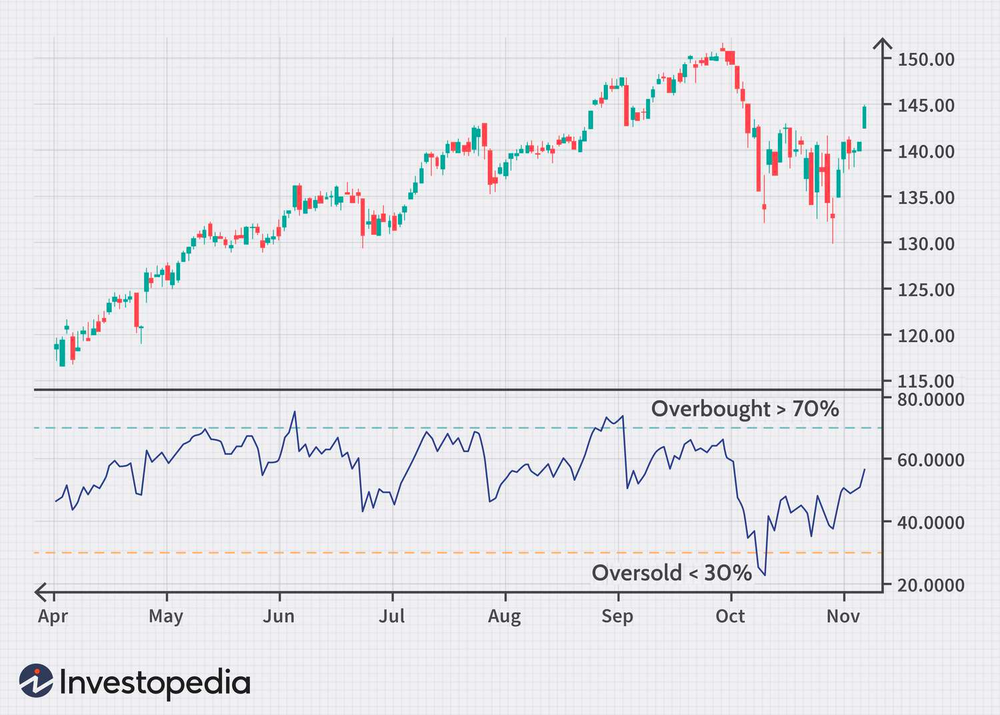
The relative strength index (RSI) is an oscillator. This type of indicator is a line graph that sits below the price chart. Oscillators typically have a scale of 0 to 100.
The RSI uses market data to measure overbought and oversold levels of the target asset. It visualized this information with a line going from left to right and lining up with the same time periods as the price chart.
When the line is 30 or lower on the scale, the asset is oversold, meaning conditions could be right for a bullish reversal. If the line is 70 or higher, your coin is likely overbought and the market could eventually fall.
The RSI is an excellent choice for confirming candlestick patterns or other reversal signals that happen near support and resistance lines.
Fibonacci Retracement
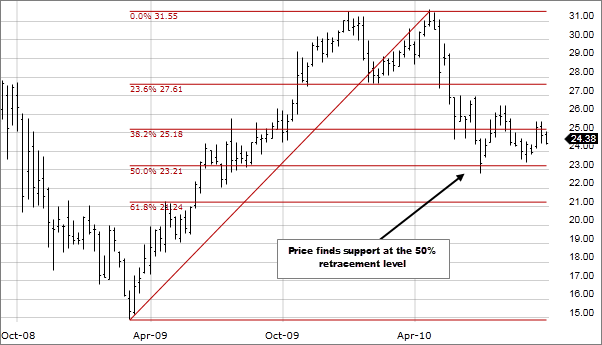
Fibonacci numbers are commonly occurring ratios in nature. In TA, traders use them to determine possible support and resistance levels. The numbers in the sequence are 23.6%, 38.2%, 50%, and 61.8%.
In trading, these numbers can alert you to possible price pullbacks (retracements) between major support and resistance levels.
If you are engaged in Bitcoin chart analysis, you won’t automatically place orders at the Fibonacci levels between established support and resistance lines. Instead, you will watch your other indicators when the market reaches these marks. If you see other buy or sell signals, you may choose to enter (go ‘long’), short (sell), or exit (close) your position.
Fidelity Investments
Bollinger Bands
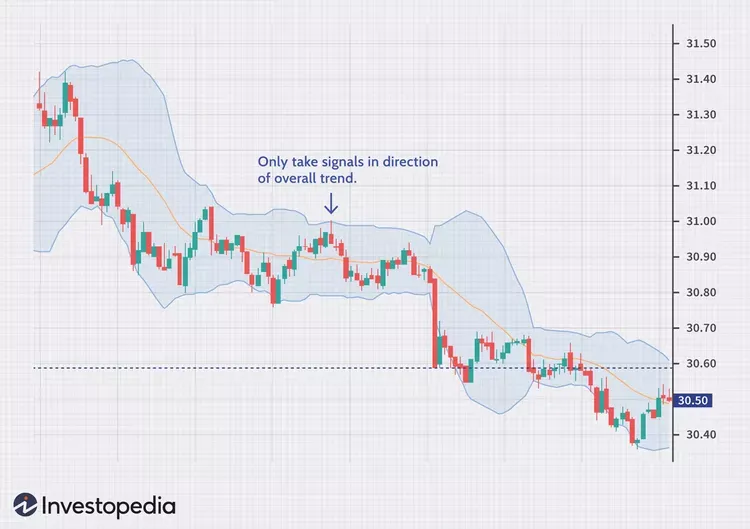
Bollinger Bands are price chart overlays. These cryptocurrency analysis indicators consist of two lines which give a hint at changing volatility. One is above and one is below the simple moving average (SMA) on a price chart. The default setting for the placement of these lines is two standard deviations from the moving average.
Like the RSI, these lines illustrate overbought and oversold conditions. You can look for candlestick patterns or other indicator signals when the price gets near one of the bands. You can also look at the width between the bands to assess volatility in the market.
Average Directional Index
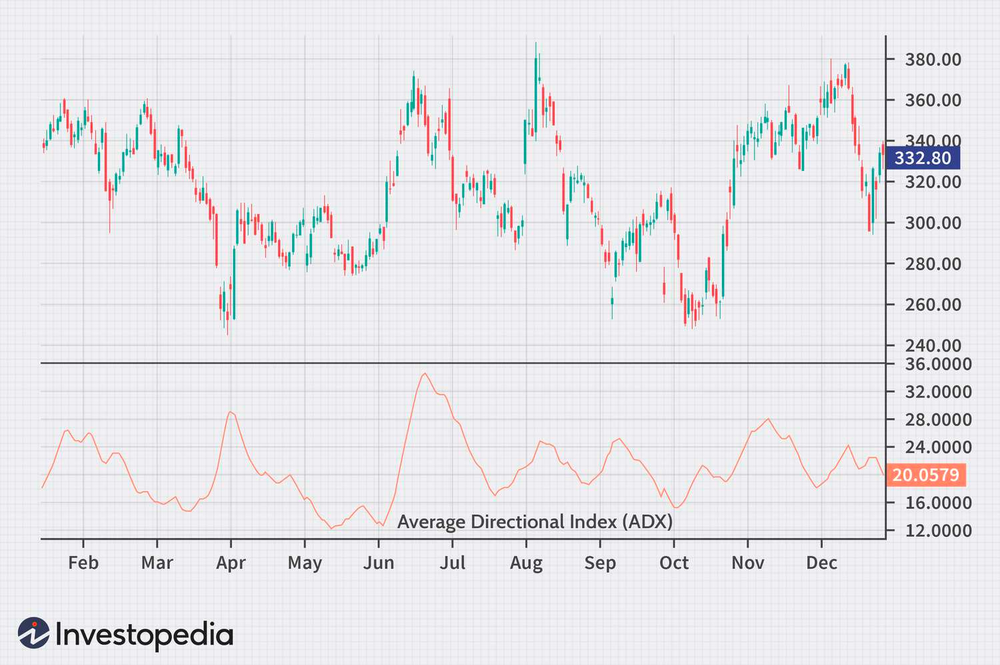
The average directional index (ADX) measures the momentum of the current directional trend. It measures the change in the moving average. Like many indicators, the ADX sits in a graph below the price chart. It is a single line that moves on a range of 0 to 100.
It is essential to understand that this indicator does not say anything about the direction of the market. It does not offer information about whether the price is rising or falling. Instead, it focuses on how strong the move is. This indicator can help traders buy into a trend early or plan their exit when a trend starts to slow down.
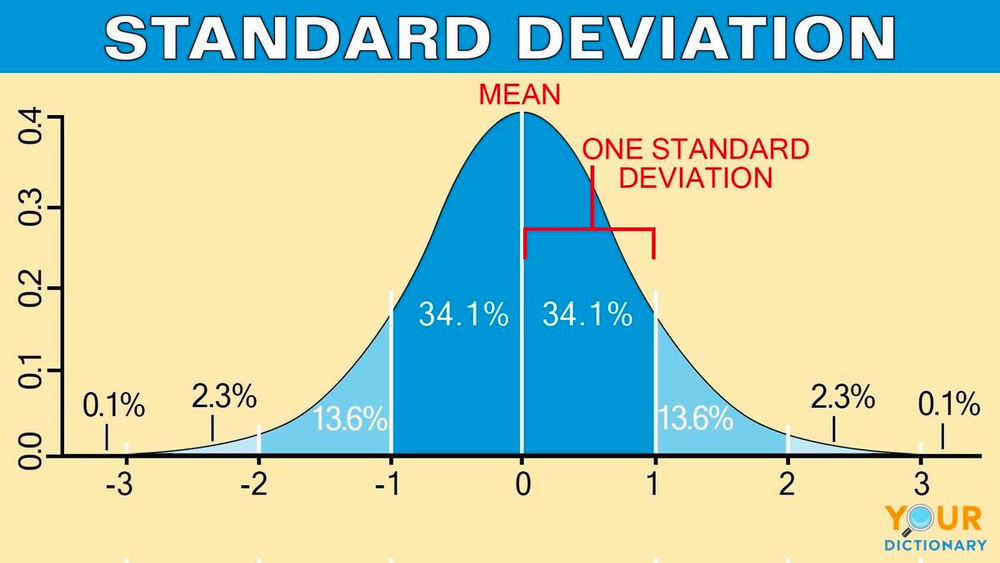
Standard Deviation
Standard deviation (SD) measures how far prices move from the average price. This crypto technical analysis tool can help measure volatility. Since rapid price swings are extremely common in cryptocurrency markets, this can be an important indicator.
You can get a standard deviation of the moving average via Bollinger Bands, but the SD indicator is a graph that sits under the price chart. It features a single line, which rises when volatility increases and falls when it decreases.
There are several uses for the SD indicator. It can help you decide where to place stop-loss and take-profit orders based on current volatility. It can also offer insight into the level of interest in less-traded markets. Long periods of low SD numbers could indicate a market with low trading volume and little interest.
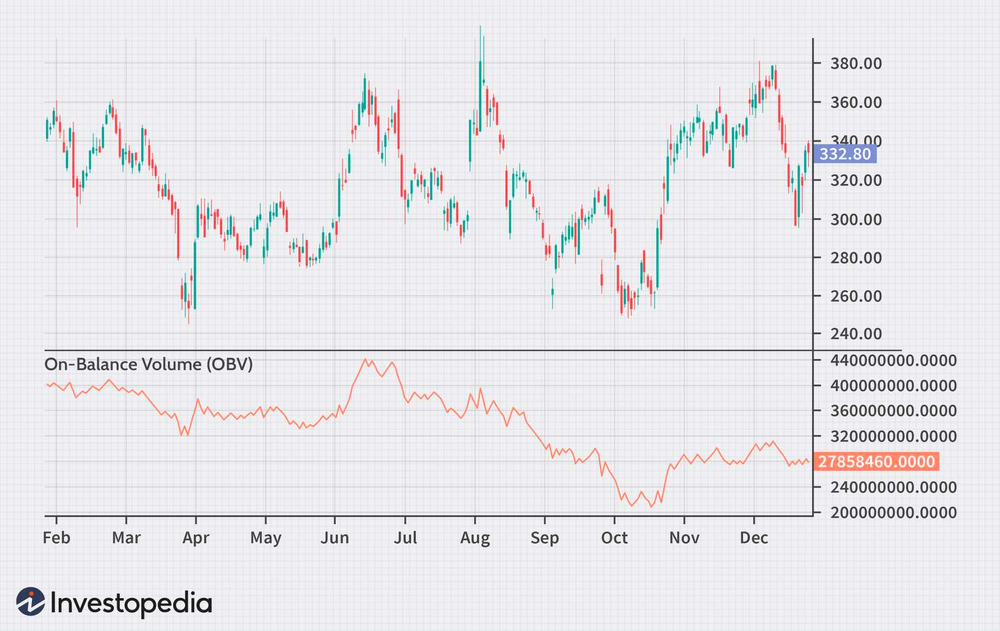
On-Balance Volume
The on-balance volume (OBV) indicator measures buying pressure. It trades the volume on up trading days and subtracts the figure on down trading days.
Why is this important? We already mentioned that some candlestick reversal patterns are more legitimate if accompanied by high trading volume. OBV helps to confirm the changes in trading volume around market moves.
On-balance volume works well to predict price action when the market approaches support and resistance levels. If there is a spike in volume, a breakout could occur. However, if buying and selling are slow, the price could respect the support or resistance level and move in the opposite direction.
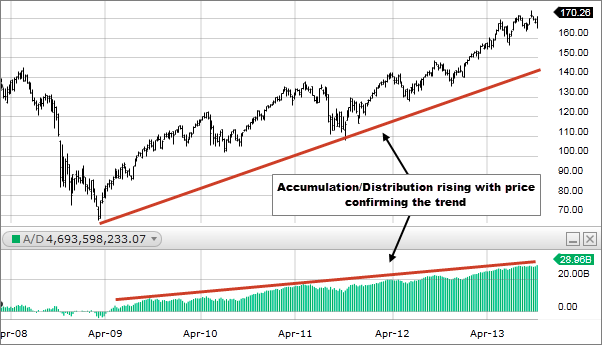
Accumulation/Distribution Line
The accumulation/distribution line (A/D indicator) is a supply and demand measure. It takes the closing price for a period and multiplies it by volume.
Most traders use this as a confirmation of a price trend. When the A/D line is rising, it indicates a rising price trend, and when it falls, the price is in a downtrend.
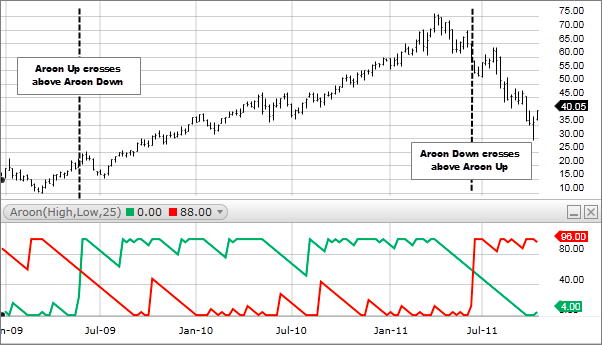
Aroon Indicator
The Aroon indicator measures the strength of trends by assessing the time between high prices and the time between low prices in a market. The theory behind this indicator is that a strong trend will often see new higher highs or lower lows.
There are two lines, an Aroon Up line and an Aroon Down line on the graph.
When the Up line is higher, the market is in a strong uptrend. When the Down line is on top, the market is likely falling.
Many traders look for the two lines to cross because this could be a signal of the start of a new trend or a change in direction in the market. Such a crossover could signal traders to look for other indicators to confirm a market reversal.
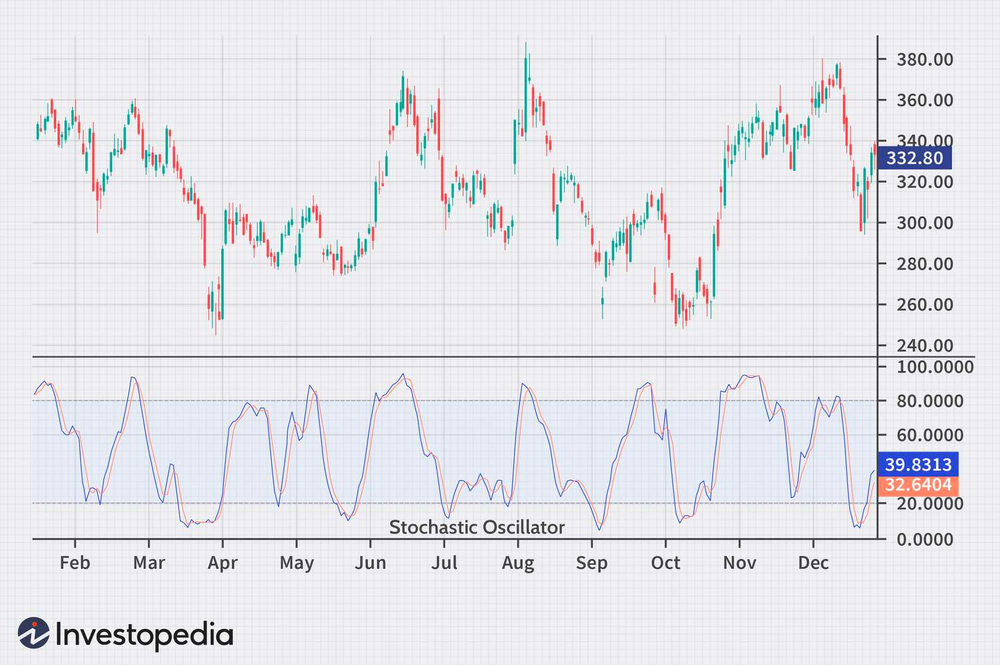
Stochastic Oscillator
A stochastic oscillator is another overbought and oversold indicator. It uses the closing price of the asset and compares it to the price of a specific period. The graph provides insight into current supply and demand levels.
Like the RSI, the stochastic oscillator consists of lines on a graph with a 0-100 scale. When the lines are below 20, demand is the dominant force and the price is likely to rise in the future. If the lines are above 80, supply rules and the market could soon fall.
The stochastic oscillator works with candlestick patterns and volume analysis. Traders may look for a stochastic line below 20 to confirm buy signals or above 80 to make a decision about sell signals.
Disclaimer: This article is not intended to provide investment, legal, accounting, tax, or any other advice and should not be relied on in that or any other regard. The information contained herein is for information purposes only and is not to be construed as an offer or solicitation for the sale or purchase of cryptocurrencies or otherwise.