Weekly Crypto Market Report: February 07-13, 2022
BTC, ETH, XRP, SHIB & More
Market Fundamentals Analysis
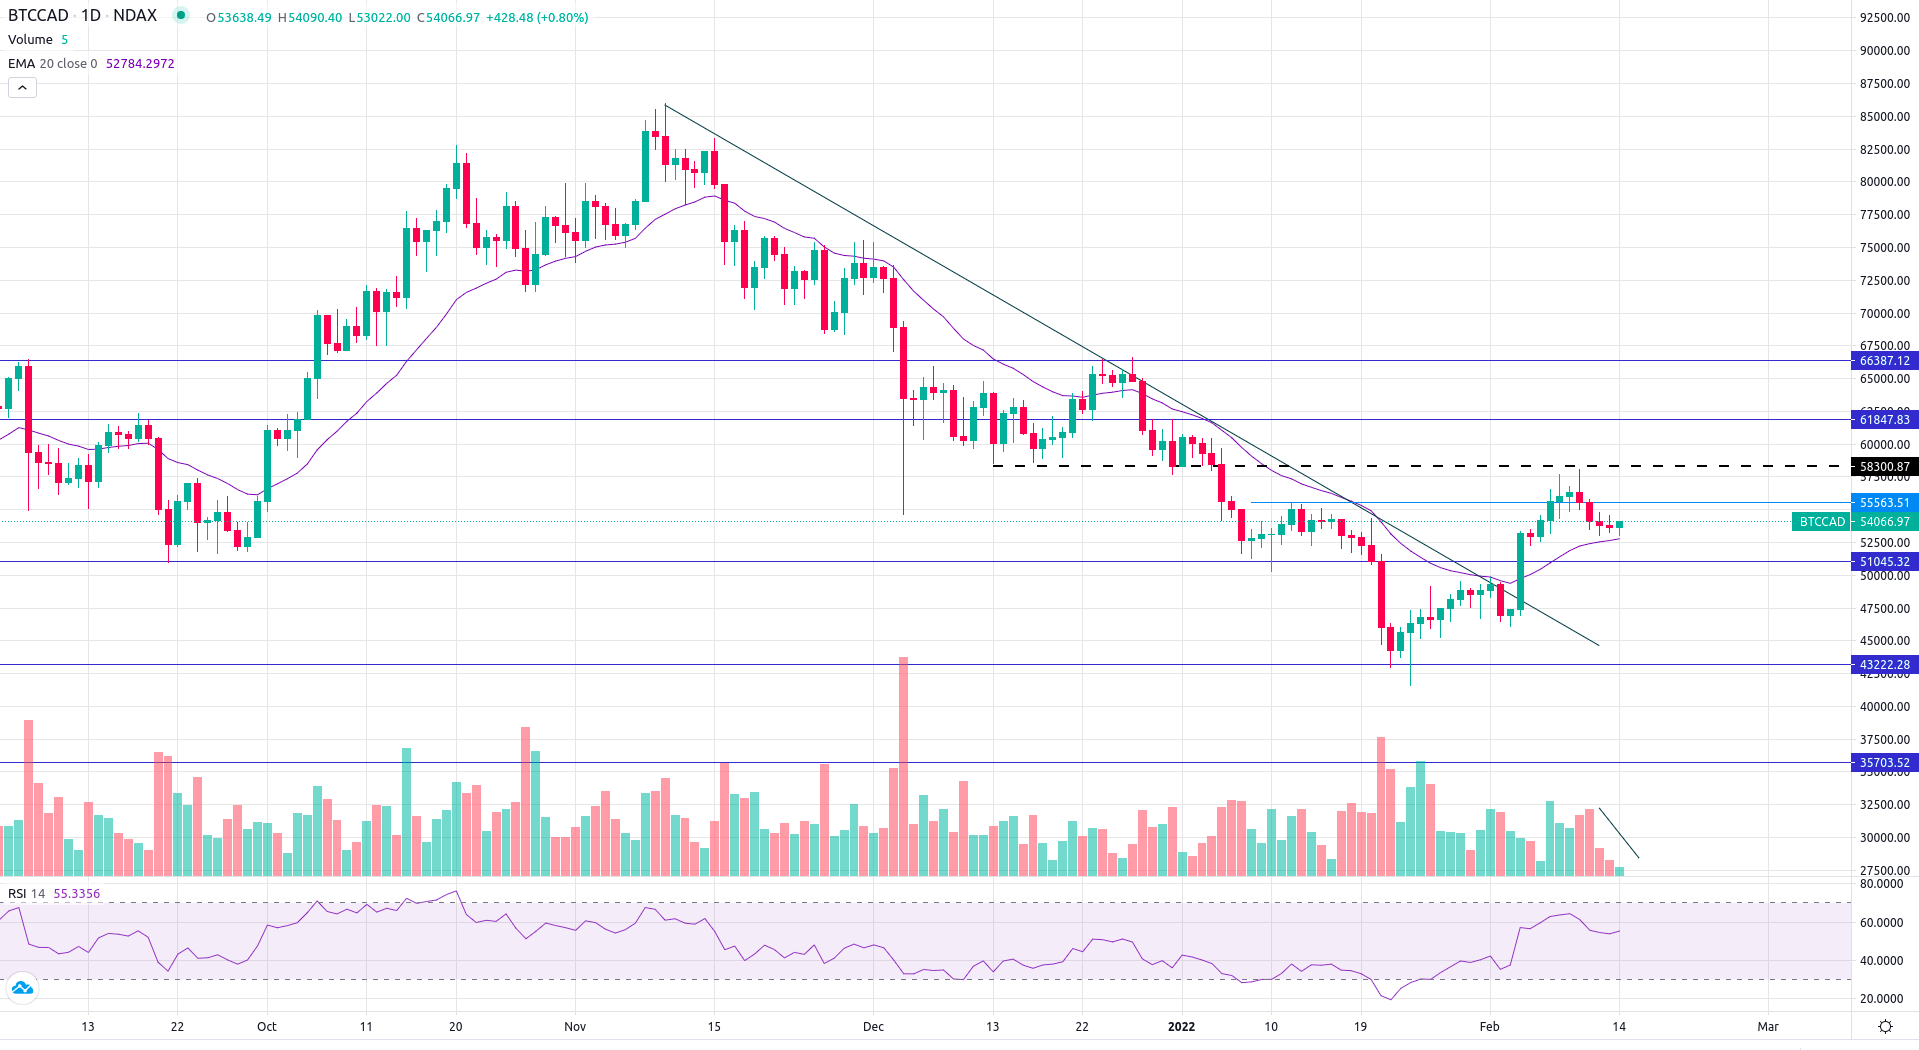
BTC was sharply rejected at the C$58k level last week. What was once a core support threshold has since turned to resistance, one likely to hold for the time being. The hot miss on the CPI report and short-term profit-taking are both driving the current price action. Since then, the asset has been on a downtrend, down 10% over the weekend. Following that move, BTC went to an extremely tight range over the weekend, between C$53,000 and C$54,500. A rather interesting development came when the Bitcoin (BTC) network recorded a new ATH hash rate of 248.11M TH/s as of February 12, 2022, further securing the decentralized ecosystem through a growing network of global BTC miners.
ETH on the other hand rallied last week to C$4,180, before correcting and solidifying its foothold on the critical C$3,500 support line and finding significant buying volume around this threshold. Yet the alt leader is reacting to inflation as expected along with the rest of the market, and also saw a turnaround over the weekend, falling back to C$3,600 levels since.
The rally the market witnessed last week was an impressive one, as it had surged by over 20% in the past week. However, most of the gains we saw seemed to have been washed out. Generally speaking, crypto has underperformed its euphoric expectations to start the year – BTC spot is down 5% and ETH has shed nearly 16% since January 1, but the story of the past two weeks has been a meaningful price rebound and an equally notable dispersion of performance amongst the top L1s.
ETH, Avalanche, Solana (Wormhole exploit notwithstanding), NEAR, and Polkadot have rallied explosively since they bottomed in late January, but once-buzzier names like Cosmos, Fantom, and Luna are still festering near the lows. While there are various chain-specific explanations for some of this divergence, microeconomic factors fail to explain the bulk of it.
As such, traders and portfolio managers should be laser-focused on identifying the broader technological and thematic drivers of beta which manifest themselves on future rallies and dips of this sort. We expect heavy chop until monetary policy uncertainty diminishes somewhat, at which point equities and, to a larger extent, crypto, are well poised for a potentially volatile liftoff.
Looking ahead, BTC’s levels look less than rosy, but if the asset bounces off the C$49,000 support, a bullish technical analysis pattern triggers, then a rally in Bitcoin and altcoins might be seen.
XRP rebounded off C$0.89 and the bulls are trying to push XRP to its next stiff resistance at C$1.20. A break and close above this resistance could lead to a possible rally to C$1.41. Most other major alts have been on a downtrend this week, with NEAR, AXS, SOL, DOT, LINK, FTM, CELO, and SAND leading this charge, falling around 15% week on week.
Despite investors’ panic induced by the BTC price roller-coaster, industry experts believe that the Bitcoin network has become verifiably stronger than ever before. While macroeconomic uncertainties continue to present themselves, crypto adoption has been growing.
We continue to see good inflows, as investors are buying on dips every time an opportunity presents itself. The overall sentiment is still largely positive, and the market is likely to remain range-bound over the next couple of days, as there is a lack of a strong signal, which could point out where we might head next.
Weekly Snapshot


Market Updates
- KPMG Canada announced that it added BTC and ETH to its balance sheet and will be looking to participate in the metaverse, NFTs, and DAOs.
- BTC network hash rate jumped 31.69% — from 188.40 EH/s to 248.11 EH/s — in just one day, ensuring resilience against attacks on the Bitcoin network.
- MakerDAO has announced that it will begin offering a maximum of $10 million bounty to white hat hackers and cybersecurity specialists who point out legitimate security threats in its smart contracts.
- Web3 platform Alchemy announced the launch of a $200-million Series C funding round this week, giving the company a decacorn status and a valuation of $10.2 billion.
Bitcoin Technical Analysis

After making a low of C$41,600, Bitcoin surged almost by 39% and made a high of C$58,073. The asset faced stiff resistance at C$58,300 (Horizontal Trendline) and witnessed some profit booking. BTC, after trading in red for four straight sessions with declining volumes, is trying to take support at its 20 Day Moving Average. If the price holds and sustains the support zone from C$51,000 to C$49,500, then the bulls may resume the up move. Once it breaks and closes above the resistance of C$58,500 then the prices can rally up to the C$65k mark. Rising Moving Average and RSI above 50 indicates a good and positive sign for the asset.

For the latest cryptocurrency prices, check out Ndax's Markets page.
Disclaimer: Information provided in the weekly market report is for information purposes only and should not be interpreted as investment, legal, or tax advice. Prior to investing, it is very important to evaluate your investment objectives and your risk tolerance carefully. This technical report is not meant to provide guarantees of future performance, and users should not rely on it, as the actual performance and financial results may differ significantly.